

1
Command Center: Remote Monitoring and Control
Live multi-view grid
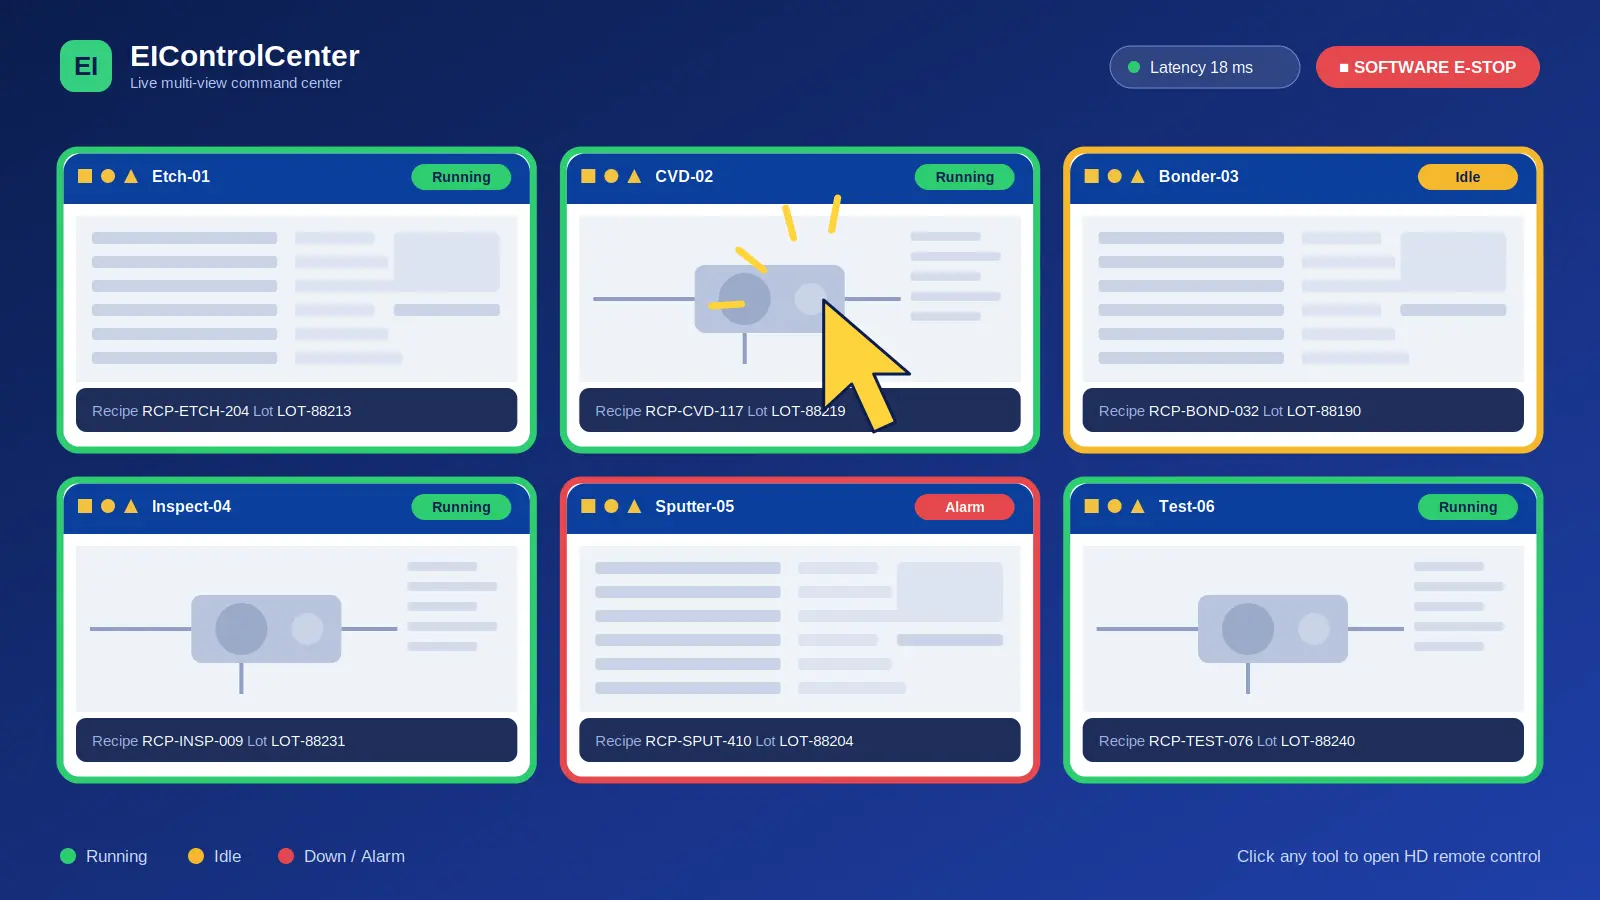
A grid of real-time video thumbnails from all equipment connected through EIGEMBox.
- ✓Color-coded status: green for running, yellow for idle, red for down or alarm, so you can judge the health of the whole floor in seconds.
- ✓At-a-glance details: the active recipe name and lot ID appear on each thumbnail without opening it.
Remote desktop interaction
- ✓Click to maximize: click any thumbnail to open a full-screen, high-definition view.
- ✓Bi-directional control: your mouse and keyboard inputs are sent to the machine through EIGEMBox, as if an operator were standing at the tool.
- ✓Latency indicator: a live display of network lag helps keep remote operation safe.
- ✓Software E-Stop: a prominent Stop button in the maximized view sends an immediate stop signal through SECS/GEM (where supported) or by input injection.
2
Deep Analytics and OEE
- ✓Real-time OEE: overall equipment effectiveness broken down into Availability, Performance and Quality.
- ✓Automated downtime tracking: the system logs every time a machine goes down.
- ✓Waterfall chart: shows exactly where production time is being lost.
3
Alarm Management
- ✓Real-time alarm banner: immediate awareness of active alarms.
- ✓Pareto analytics: the top 10 most frequent alarms and the top 10 alarms causing the most downtime.
- ✓Smart escalation: if a critical alarm stays unacknowledged for a set period, the system escalates it by email or SMS to the floor manager.
4
Equipment Performance and Reliability
- ✓Machine-to-machine comparison: identify underperforming assets directly.
- ✓Reliability metrics: track mean time between failures (MTBF) and mean time to repair (MTTR).
5
Performance Tracking and Projections
- ✓Estimated completion time: calculated from the current run rate.
- ✓Proactive alerts: if a projection exceeds your expectation, the system alerts management hours before a target is missed.